


Summary
Background
Since Dec 31, 2019, the Chinese city of Wuhan has reported an outbreak of atypical pneumonia caused by the 2019 novel coronavirus (2019-nCoV). Cases have been exported to other Chinese cities, as well as internationally, threatening to trigger a global outbreak. Here, we provide an estimate of the size of the epidemic in Wuhan on the basis of the number of cases exported from Wuhan to cities outside mainland China and forecast the extent of the domestic and global public health risks of epidemics, accounting for social and non-pharmaceutical prevention interventions.
Methods
We used data from Dec 31, 2019, to Jan 28, 2020, on the number of cases exported from Wuhan internationally (known days of symptom onset from Dec 25, 2019, to Jan 19, 2020) to infer the number of infections in Wuhan from Dec 1, 2019, to Jan 25, 2020. Cases exported domestically were then estimated. We forecasted the national and global spread of 2019-nCoV, accounting for the effect of the metropolitan-wide quarantine of Wuhan and surrounding cities, which began Jan 23–24, 2020. We used data on monthly flight bookings from the Official Aviation Guide and data on human mobility across more than 300 prefecture-level cities in mainland China from the Tencent database. Data on confirmed cases were obtained from the reports published by the Chinese Center for Disease Control and Prevention. Serial interval estimates were based on previous studies of severe acute respiratory syndrome coronavirus (SARS-CoV). A susceptible-exposed-infectious-recovered metapopulation model was used to simulate the epidemics across all major cities in China. The basic reproductive number was estimated using Markov Chain Monte Carlo methods and presented using the resulting posterior mean and 95% credibile interval (CrI).
Findings
In our baseline scenario, we estimated that the basic reproductive number for 2019-nCoV was 2·68 (95% CrI 2·47–2·86) and that 75 815 individuals (95% CrI 37 304–130 330) have been infected in Wuhan as of Jan 25, 2020. The epidemic doubling time was 6·4 days (95% CrI 5·8–7·1). We estimated that in the baseline scenario, Chongqing, Beijing, Shanghai, Guangzhou, and Shenzhen had imported 461 (95% CrI 227–805), 113 (57–193), 98 (49–168), 111 (56–191), and 80 (40–139) infections from Wuhan, respectively. If the transmissibility of 2019-nCoV were similar everywhere domestically and over time, we inferred that epidemics are already growing exponentially in multiple major cities of China with a lag time behind the Wuhan outbreak of about 1–2 weeks.
Interpretation
Given that 2019-nCoV is no longer contained within Wuhan, other major Chinese cities are probably sustaining localised outbreaks. Large cities overseas with close transport links to China could also become outbreak epicentres, unless substantial public health interventions at both the population and personal levels are implemented immediately. Independent self-sustaining outbreaks in major cities globally could become inevitable because of substantial exportation of presymptomatic cases and in the absence of large-scale public health interventions. Preparedness plans and mitigation interventions should be readied for quick deployment globally.
Funding
Health and Medical Research Fund (Hong Kong, China).
Introduction
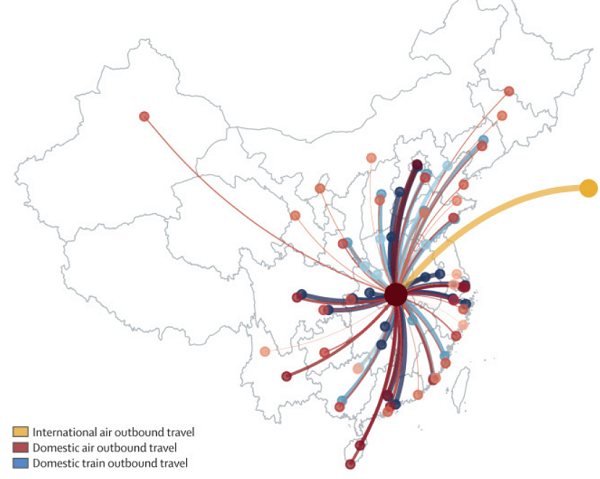
Wuhan, the capital of Hubei province in China, is investigating an outbreak of atypical pneumonia caused by the zoonotic 2019 novel coronavirus (2019-nCoV). As of Jan 29, 2020 (1100 h Hong Kong time), there have been 5993 cases of 2019-nCoV infections confirmed in mainland China ( figure 1 ), including 132 deaths. As of Jan 28, 2020 (1830 h Hong Kong time), there have been 78 exported cases from Wuhan to areas outside mainland China ( appendix p 2–4 ). 
Figure 1Risk of spread outside Wuhan
The National Health Commission of China has developed a case-definition system to facilitate the classification of patients ( panel ). To mitigate the spread of the virus, the Chinese Government has progressively implemented metropolitan-wide quarantine of Wuhan and several nearby cities since Jan 23–24, 2020. Numerous domestic airports and train stations, as well as international airports, have adopted temperature screening measures to detect individuals with fever.
Panel
Case definitions of 2019 novel coronavirus (2019-nCoV)
The case definition of 2019-nCoV differs depending on the context in which it is used.
Case definition of the Chinese Center for Disease Control and Prevention (CDC)
A suspected or probable case is defined as a case that meets: (1) three clinical criteria or (2) two clinical criteria and one epidemiological criterion. Clinical criteria are: fever; radiographic evidence of pneumonia or acute respiratory distress syndrome; and low or normal white blood cell count or low lymphocyte count. Epidemiological criteria are: living in Wuhan or travel history to Wuhan within 14 days before symptom onset; contact with patients with fever and symptoms of respiratory infection within 14 days before symptom onset; and a link to any confirmed cases or clusters of suspected cases.
The definition of a confirmed case, for the first case in a province, is a suspected or probable case with detection of viral nucleic acid at the city CDC and provincial CDC. For the second case and all subsequent cases, the definition is a suspected or probable case with detection of virus nucleic acid at the city CDC.
Case definition used in the case exportation model in this study
We defined cases as individuals who were symptomatic, who could be detected by temperature screening at international borders, or who had a disease severity requiring hospital admission, or both, plus travel history to Wuhan.
Research in context
Evidence before this study
In central China, Wuhan is investigating an outbreak of atypical pneumonia caused by the zoonotic 2019 novel coronavirus (2019-nCoV). Few data and details are currently available. Two other novel coronaviruses (CoVs) have emerged as major global epidemics in recent decades; in 2002, severe acute respiratory syndrome coronavirus (SARS-CoV) spread to 37 countries and caused more than 8000 cases and almost 800 deaths, and in 2012, Middle East respiratory syndrome coronavirus (MERS-CoV) spread to 27 countries, causing 2494 cases and 858 deaths worldwide to date. These CoVs are both zoonotic and have low potential for sustained community transmission. However, larger clusters involving superspreading events were observed for SARS in 2003 and MERS in 2014–17. As of Jan 25, 2020, the scale and geographical extent of the 2019-nCoV outbreak both within and outside mainland China are highly uncertain. National and global spread of this disease is particularly concerning given that chunyun, a 40-day period with extremely high air and train traffic across China because of the lunar new year Spring Festival, began on Jan 10, 2020. We searched PubMed and preprint archives for articles published up to Jan 25, 2020, that contained information about the Wuhan outbreak using the terms “coronavirus”, “CoV”, “2019-nCoV”, “Wuhan”, “transmission”, “China”, “superspreading”, and “Chinese New Year”. We found six studies that reported the relative risks of case exportation from Wuhan to areas outside mainland China.
Added value of this study
In the absence of a robust and complete line list for characterising the epidemiology of this novel pathogen, we inferred the outbreak size of 2019-nCoV in Wuhan from the number of confirmed cases that have been exported to cities outside mainland China. We used this outbreak size estimate to project the number of cases that have been exported to other Chinese cities. We forecasted the spread of 2019-nCoV both within and outside of mainland China.
Implications of all the available evidence
Preparedness plans should be readied for quick deployment worldwide, especially in cities with close travel links with Wuhan and other major Chinese cities.
Two other novel coronaviruses (CoVs) have emerged as major global health threats since 2002, namely severe acute respiratory syndrome coronavirus (SARS-CoV; in 2002) that spread to 37 countries, and Middle East respiratory syndrome coronavirus (MERS-CoV; in 2012) that spread to 27 countries. SARS-CoV caused more than 8000 infections and 800 deaths, and MERS-CoV infected 2494 individuals and caused 858 deaths worldwide to date. Both are zoonotic viruses and epidemiologically similar, except that SARS-CoV has virtually no subclinical manifestation, whereas MERS-CoV behaves more similarly to the other four commonly circulating human CoVs, with a substantial proportion of asymptomatic infections ( table 1 ). Symptomatic cases of both viruses usually present with moderate-to-severe respiratory symptoms that often progress to severe pneumonia.
Table 1Epidemiological characteristics of human CoVs
| Basic reproductive number, mean (95% CI), or prevalence of infection (for commonly circulating human CoVs) | Beijing: 1·88 overall, 0·94 after generation 1 (excluding SSE). Hong Kong: 1·70 (0·44–2·29) overall, 2·7 (2·2–3·7) in the early phase (excluding SSE), range 0·14–1 in the later phase (excluding SSE). Singapore: 1·63 overall or 1·83 (0·47–2·47) overall, range 2·2–3·6 in the early phase (including SSE). Toronto 0·86 (0·24–1·18) overall. Worldwide: 0·95 (0·67–1·23) overall. | Middle East: 0·47 (0·29–0·80) overall. Saudi Arabia: 0·45 (0·33–0·58) overall. Middle East and South Korea: 0·91 (0·36–1·44) overall. South Korea: range 2·0–8·1 in early phase (including SSE). | 229E and OC43 in USA: annual infection attack rates of 2·8% to 26·0% in prospective cohorts. Guangzhou, China: CoVs detected in 2·25% of adults and children with fever and upper respiratory infection symptoms, among which 60% were OC43, 17% were 229E, 15% were NL63, and 7·8% were HKU1. UK: CoVs detected in all age groups, most frequently in children aged 7–12 months (4·86%) |
| Incubation period, days, mean (SD) or mean (95% CI) | Hong Kong: 4·6 (3·8–5·8). Hong Kong: 4·4 (4·6). Beijing: 5·7 (9·7). Taiwan: 6·9 (6·1) | Saudi Arabia: 5·0 (4·0–6·6). South Korea: 6·9 (6·3–7·5). | OC43 and other common human CoVs: range 2–4. common human CoVs: range 2–5. Common human CoVs: range 3–4. |
| Serial interval, days, mean (SD) | Singapore: 8·4 (3·8). | Saudi Arabia: 6·8 (4·1). South Korea: 12·4 (2·8). | ·· |
| Seroprevalence among non-cases | Hong Kong, among close contacts: around 0%. | Qatar: 0·21% (10 of 4719) among healthy blood donors, 0·74% (1 of 135) among individuals who are close contacts of cases but not sick. Arabian Peninsula: 0·15% (15 of 10 365) among general population, 6·2% (68 of 1090) among individuals exposed to camels. | OC43 and 229E: 86–100%. HKU1, S-protein-based ELISA: 0% in children aged |
| Case-hospitalisation probability, mean (95% CI) | Around 100%. | South Korea: around 100%. | OC43 in Canada: 12·6% among older and disabled adults in a long-term care facility. 229E and OC43 in USA: prevalence of 3·3–11·1% in a hospitalised cohort. Brazil: 11% among children aged |
| Case-fatality proportion | Worldwide (WHO): 9·6% among probable cases. mainland China: 6·4% among probable cases. Hong Kong: 17% among laboratory-confirmed cases. | Worldwide (WHO): 34·5% among laboratory-confirmed cases. South Korea: 20·4% among laboratory-confirmed cases. | ·· |
CoV=coronavirus. SARS=severe acute respiratory syndrome. MERS=Middle East respiratory syndrome. SSE=superspreading event.
* Data are mean (IQR).
A notable common characteristic of both SARS-CoV and MERS-CoV is that they have low potential for sustained community transmission (ie, low basic reproductive number). , , However, the most worrisome aspect is the ability of the viruses to cause unusually large case clusters via superspreading, which can exceed 100 individuals and are apparently seeded by a single index case. , , , ,
In this study, we provide a nowcast of the probable size of the epidemic, recognising the challenge of complete ascertainment of a previously unknown pathogen with an unclear clinical spectrum and testing capacity, even after identification of the aetiological cause. More importantly, from a public health control viewpoint, we then forecast the probable course of spread domestically and internationally, first by assuming similar transmissibility as the initial phase in Wuhan (ie, little or no mitigation interventions), then accounting for the potential impact of the various social and personal non-pharmaceutical interventions that have been progressively and quickly implemented in January, 2020.
Methods
Data sources and assumptions
In this modelling study, we first inferred the basic reproductive number of 2019-nCoV and the outbreak size in Wuhan from Dec 1, 2019, to Jan 25, 2020, on the basis of the number of cases exported from Wuhan to cities outside mainland China. We then estimated the number of cases that had been exported from Wuhan to other cities in mainland China. Finally, we forecasted the spread of 2019-nCoV within and outside mainland China, accounting for the Greater Wuhan region quarantine implemented since Jan 23–24, 2020, and other public health interventions.
Wuhan is the major air and train transportation hub of central China ( figure 1 ). We estimated the daily number of outbound travellers from Wuhan by air, train, and road with data from three sources (see appendix p 1 for details): (1) the monthly number of global flight bookings to Wuhan for January and February, 2019, obtained from the Official Aviation Guide (OAG); (2) the daily number of domestic passengers by means of transportation recorded by the location-based services of the Tencent (Shenzhen, China) database from Wuhan to more than 300 prefecture-level cities in mainland China from Jan 6 to March 7, 2019; and (3) the domestic passenger volumes from and to Wuhan during chunyun 2020 (Spring Festival travel season; appendix p 1 ) estimated by Wuhan Municipal Transportation Management Bureau and press-released in December, 2019.
On Jan 19, 2020, the Chinese Center for Disease Control and Prevention (CDC) reported that only 43 (22%) of the 198 confirmed cases in its outbreak investigation had been exposed to the Huanan seafood wholesale market, the most probable index source of zoonotic 2019-nCoV infections, which was closed and disinfected on Jan 1, 2020. As such, and because of the difficulties of tracing all infections, we assumed that during Dec 1–31, 2019, the epidemic in Wuhan was seeded by a constant zoonotic force of infection that caused 86 cases (ie, twice the 43 confirmed cases with zoonotic exposure) in our baseline scenario. For the sensitivity analysis, we assumed 129 and 172 cases (50% and 100% higher than the baseline scenario value). Given that both 2019-nCoV and SARS-CoV could cause self-sustaining human-to-human transmission in the community, we assumed that the serial interval of 2019-nCoV was the same as that of SARS-CoV in Hong Kong (mean 8·4 days; table 1 ). We assumed that the incubation period of 2019-nCoV was similar to that of SARS-CoV and MERS-CoV (mean 6 days; table 1 ). These assumptions are consistent with preliminary estimates of the serial interval (mean 7·5 days) and incubation period (mean 6·1 days) using line-list data from China CDC.
Estimating the transmissibility and outbreak size of 2019-nCoV in Wuhan
We assumed that the catchment population size of the Wuhan Tianhe International Airport at Wuhan was 19 million (ie, Greater Wuhan region with 11 million people from Wuhan city plus 8 million from parts of several neighbouring cities). We estimated the number of cases in Greater Wuhan on the basis of the number of confirmed cases exported to cities outside mainland China whose symptom onset date had been reported to fall from Dec 25, 2019, to Jan 19, 2020 ( appendix pp 2–4 ). The start date of this period (day Ds) corresponded to one mean incubation period before the Wuhan outbreak was announced on Dec 31, 2019, whereas the end date (day De) was 7 days before the time of writing (Jan 26, 2020). This end date was chosen to minimise the effect of lead time bias on case confirmation (the time between onset and case confirmation was ≤7 days in 46 [80%] of 55 cases exported to cities outside mainland China; see appendix pp 2–4 ). We let χd to be the number of such case exportation on day d.
Our 2019 OAG data indicated that for cities outside mainland China excluding Hong Kong, the daily average number of international outbound air passengers was LW,I=3633 and that of international inbound air passengers was LI,W=3546 in Greater Wuhan during January–February, 2019 ( table 2 ). We excluded Hong Kong in this estimate because travel from mainland China to Hong Kong had dropped sharply since August, 2019, because of social unrest in Hong Kong. Our calibrated Tencent mobility data indicated that for cities in mainland China, the daily number of all domestic outbound travellers was LW,C(t)=502 013 and that of all domestic inbound travellers was LC,W(t)=487 310 in Wuhan at time t before chunyun (Jan 10). During chunyun, these estimates were LW,C(t)=717 226 and LC,W(t)=810 500.
Table 2Cities outside of mainland China to which Wuhan had the greatest volume of outbound air travel in January–February, 2019
| Bangkok | 16 202 |
| Hong Kong | 7531 |
| Seoul | 5982 |
| Singapore | 5661 |
| Tokyo | 5269 |
| Taipei | 5261 |
| Kota Kinabalu | 4531 |
| Phuket | 4411 |
| Macau | 3731 |
| Ho Chi Minh City | 3256 |
| Kaohsiung | 2718 |
| Osaka | 2636 |
| Sydney | 2504 |
| Denpasar-Bali | 2432 |
| Phnom Penh | 2000 |
| London | 1924 |
| Kuala Lumpur | 1902 |
| Melbourne | 1898 |
| Chiang Mai | 1816 |
| Dubai | 1799 |
Data were obtained from the Official Airline Group.
* Due to the ongoing social unrest since June, 2019, we used actual flight volume based on local estimates in the models.
We used the following susceptible-exposed-infectious-recovered (SEIR) model to simulate the Wuhan epidemic since it was established in December, 2019:
where S(t), E(t), I(t), and R(t) were the number of susceptible, latent, infectious, and removed individuals at time t; DE and DI were the mean latent (assumed to be the same as incubation) and infectious period (equal to the serial interval minus the mean latent period ); R0 was the basic reproductive number; z(t) was the zoonotic force of infection equal to 86 cases per day in the baseline scenario before market closure on Jan 1, 2020, and equal to 0 thereafter. The cumulative number of infections and cases that had occurred in Greater Wuhan up to time t was obtained from the SEIR model.
dS(t)dt=-S(t)N(R0DII(t)+z(t))+LI,W+LC,W(t)-(LW,IN+LW,C(t)N)S(t)">dS(t)dt=−S(t)N(R0DII(t)+z(t))+LI,W+LC,W(t)−(LW,IN+LW,C(t)N)S(t)dS(t)dt=-S(t)N(R0DII(t)+z(t))+LI,W+LC,W(t)-(LW,IN+LW,C(t)N)S(t)
dEdt=S(t)N(R0DII(t)+z(t))-E(t)DE-(LW,IN+LW,C(t)N)E(t)">dEdt=S(t)N(R0DII(t)+z(t))−E(t)DE−(LW,IN+LW,C(t)N)E(t)dEdt=S(t)N(R0DII(t)+z(t))-E(t)DE-(LW,IN+LW,C(t)N)E(t)
dI(t)dt=E(t)DE-I(t)DI-(LW,IN+LW,C(t)N)I(t)">dI(t)dt=E(t)DE−I(t)DI−(LW,IN+LW,C(t)N)I(t)dI(t)dt=E(t)DE-I(t)DI-(LW,IN+LW,C(t)N)I(t)
where S(t), E(t), I(t), and R(t) were the number of susceptible, latent, infectious, and removed individuals at time t; DE and DI were the mean latent (assumed to be the same as incubation) and infectious period (equal to the serial interval minus the mean latent period ); R0 was the basic reproductive number; z(t) was the zoonotic force of infection equal to 86 cases per day in the baseline scenario before market closure on Jan 1, 2020, and equal to 0 thereafter. The cumulative number of infections and cases that had occurred in Greater Wuhan up to time t was obtained from the SEIR model.
We assumed that travel behaviour was not affected by disease and hence international case exportation occurred according to a non-homogeneous process with rate
As such, the expected number of international case exportation on day d was
Taken together, the likelihood function was
λ(t)=LW,IN(E(t)+I(t))">λ(t)=LW,IN(E(t)+I(t))λ(t)=LW,IN(E(t)+I(t))
As such, the expected number of international case exportation on day d was
λd=∫d-1dλ(u)du">λd=∫dd−1λ(u)duλd=∫d-1dλ(u)du
Taken together, the likelihood function was
L(R0)=∏d=DSDee-λdλdxdxd!">L(R0)=∏Ded=DSe−λdλxddxd!L(R0)=∏d=DSDee-λdλdxdxd!
We estimated R0 using Markov Chain Monte Carlo methods with Gibbs sampling and non-informative flat prior. For a given R0 from the resulting posterior distribution, we used the same SEIR model to estimate the corresponding outbreak size in Wuhan and the probability distribution of the number of cases that had been exported domestically to other cities in mainland China (on the basis of the destination distribution in our calibrated Tencent mobility data). Point estimates were presented using posterior means, and statistical uncertainty was presented using 95% credible intervals (CrIs).
Nowcasting and forecasting the spread of 2019-nCoV in China and worldwide
We extended the above SEIR model into a SEIR-metapopulation model to simulate the spread of 2019-nCoV across mainland China, assuming the transmissibility of 2019-nCoV was similar across all cities. The movements of individuals between more than 300 prefecture-level cities were modelled using the daily average traffic volumes in our calibrated Tencent mobility data. Given that 2019-nCoV has caused widespread outbreak awareness not only among public health professionals (ie, WHO and government health authorities), but also among the general public in China and other countries, the transmissibility of the epidemic might be reduced compared with its nascent stage at Wuhan because of community-wide social distancing measures and other non-pharmaceutical interventions (eg, use of face masks and improved personal hygiene). Previous studies suggested that non-pharmaceutical interventions might be able to reduce influenza transmission by up to 50%. As such, we simulated local epidemics across mainland China assuming that the transmissibility of 2019-nCoV was reduced by 0%, 25%, and 50% after Wuhan was quarantined on Jan 23, 2020. The epidemics would fade out if transmissibility could be reduced by 1–1/R0. Furthermore, we considered 50% reduction in inter-city mobility. Finally, we hypothesised that citywide population quarantine at Wuhan had negligible effect on the epidemic trajectories of the rest of the country and tested this hypothesis by making the extreme assumption that all inbound and outbound mobility at Wuhan were eliminated indefinitely on Jan 23, 2020.
Role of the funding source
The funder of the study had no role in study design, data collection, data analysis, data interpretation, or writing of the report. The corresponding author had full access to all the data in the study and had final responsibility for the decision to submit for publication.
Results
Figure 2 summarises our estimates of the basic reproductive number R0 and the outbreak size of 2019-nCoV in Wuhan as of Jan 25, 2020. In our baseline scenario, we estimated that R0 was 2·68 (95% CrI 2·47–2·86) with an epidemic doubling time of 6·4 days (95% CrI 5·8–7·1; figure 2 ). We estimated that 75 815 individuals (95% CrI 37 304–130 330) individuals had been infected in Greater Wuhan as of Jan 25, 2020. We also estimated that Chongqing, Beijing, Shanghai, Guangzhou, and Shenzhen, had imported 461 (227–805), 113 (57–193), 98 (49–168), 111 (56–191), and 80 (40–139) infections from Wuhan, respectively ( figure 3 ). Beijing, Shanghai, Guangzhou, and Shenzhen were the mainland Chinese cities that together accounted for 53% of all outbound international air travel from China and 69% of international air travel outside Asia, whereas Chongqing is a large metropolis that has a population of 32 million and very high ground traffic volumes with Wuhan. Substantial epidemic take-off in these cities would thus contribute to the spread of 2019-nCoV within and outside mainland China. 

Figure 2Posterior distributions of estimated basic reproductive number and estimated outbreak size in greater Wuhan
Figure 3Estimated number of cases exported to the Chinese cities to which Wuhan has the highest outbound travel volumes
If the zoonotic force of infection that initiated the Wuhan epidemic was 50% and 100% higher than the baseline scenario value, then R0 would be 2·53 (95% CrI 2·32–2·71) and 2·42 (2·22–2·60), respectively. The corresponding estimate of the number of infections in Wuhan would be 38% and 56% lower than baseline. The number of exported cases and infections in Chongqing, Beijing, Shanghai, Guangzhou, and Shenzhen would be similarly reduced in magnitude ( figure 3 ).
Figure 4 shows the epidemic curves for Wuhan, Chongqing, Beijing, Shanghai, Guangzhou, and Shenzhen with a R0 of 2·68, assuming 0%, 25%, or 50% decrease in transmissibility across all cities, together with 0% or 50% reduction in inter-city mobility after Wuhan was quarantined on Jan 23, 2020. The epidemics would fade out if transmissibility was reduced by more than 1–1/R0=63%. Our estimates suggested that a 50% reduction in inter-city mobility would have a negligible effect on epidemic dynamics. We estimated that if there was no reduction in transmissibility, the Wuhan epidemic would peak around April, 2020, and local epidemics across cities in mainland China would lag by 1–2 weeks. If transmissibility was reduced by 25% in all cities domestically, then both the growth rate and magnitude of local epidemics would be substantially reduced; the epidemic peak would be delayed by about 1 month and its magnitude reduced by about 50%. A 50% reduction in transmissibility would push the viral reproductive number to about 1·3, in which case the epidemic would grow slowly without peaking during the first half of 2020. However, our simulation suggested that wholesale quarantine of population movement in Greater Wuhan would have had a negligible effect on the forward trajectories of the epidemic because multiple major Chinese cities had already been seeded with more than dozens of infections each (results not shown because they are visually indistinguishable from figure 4 ). The probability that the chain of transmission initiated by an infected case would fade out without causing exponential epidemic growth decreases sharply as R0 increases (eg, <0·2 when R0>2). , As such, given the substantial volume of case importation from Wuhan ( figure 3 ), local epidemics are probably already growing exponentially in multiple major Chinese cities. Given that Beijing, Shanghai, Guangzhou, and Shenzhen together accounted for more than 50% of all outbound international air travel in mainland China, other countries would likely be at risk of experiencing 2019-nCoV epidemics during the first half of 2020. 
Figure 4Epidemic forecasts for Wuhan and five other Chinese cities under different scenarios of reduction in transmissibility and inter-city mobility
Discussion
During the period of an epidemic when human-to-human transmission is established and reported case numbers are rising exponentially, nowcasting and forecasting are of crucial importance for public health planning and control domestically and internationally. , In this study, we have estimated the outbreak size of 2019-nCoV thus far in Wuhan and the probable extent of disease spread to other cities domestically. Our findings suggest that independent self-sustaining human-to-human spread is already present in multiple major Chinese cities, many of which are global transport hubs with huge numbers of both inbound and outbound passengers (eg, Beijing, Shanghai, Guangzhou, and Shenzhen).
Therefore, in the absence of substantial public health interventions that are immediately applied, further international seeding and subsequent local establishment of epidemics might become inevitable. On the present trajectory, 2019-nCoV could be about to become a global epidemic in the absence of mitigation. Nevertheless, it might still be possible to secure containment of the spread of infection such that initial imported seeding cases or even early local transmission does not lead to a large epidemic in locations outside Wuhan. To possibly succeed, substantial, even draconian measures that limit population mobility should be seriously and immediately considered in affected areas, as should strategies to drastically reduce within-population contact rates through cancellation of mass gatherings, school closures, and instituting work-from-home arrangements, for example. Precisely what and how much should be done is highly contextually specific and there is no one-size-fits-all set of prescriptive interventions that would be appropriate across all settings. Should containment fail and local transmission is established, mitigation measures according to plans that had been drawn up and executed during previous major outbreaks, such as those of SARS, MERS, or pandemic influenza, could serve as useful reference templates.
The overriding epidemiological priority to inform public health control would be to compile and release a line list of suspected, possible, probable, and confirmed cases and close contacts that is updated daily and linked to clinical outcomes and laboratory test results. A robust line list is essential for the generation of accurate and precise epidemiological parameters as inputs into transmission models to inform situational awareness and optimising the responses to the epidemic. Additionally, given the extent of spread and level of public concern it has already generated, the clinical spectrum and severity profile of 2019-nCoV infections needs rapid ascertainment by unbiased and reliable methods in unselected samples of cases, especially those with mild or subclinical presentations.
The modelling techniques that we used in this study are very similar to those used by other researchers who are working towards the same goal of characterising the epidemic dynamics of 2019-nCoV (Zhanwei Du, University of Texas at Austin, personal communication). , , , The consensus on our methodology provides some support for the validity of our nowcasts and forecasts. An additional strength of our study is that our model is parameterised with the latest mobility data from OAG and Tencent. Nonetheless, our study has several major limitations. First, we assumed that travel behaviour was not affected by disease status and that all infections eventually have symptoms (albeit possibly very mild). We would have underestimated the outbreak size in Greater Wuhan if individuals with increased risk of infection (eg, confounded by socioeconomic status) were less likely to travel internationally or if the proportion of asymptomatic infections were substantial. Second, our estimate of transmissibility and outbreak size was somewhat sensitive to our assumption regarding the zoonotic mechanism that initiated the epidemic at Wuhan. However, our overall conclusion regarding the extent of case exportation in major Chinese cities would remain the same even for our lowest estimate of transmissibility ( figure 3 ). Third, our epidemic forecast was based on inter-city mobility data from 2019 that might not necessarily reflect mobility patterns in 2020, especially in the presence of current public vigilance and response regarding the health threat posed by 2019-nCoV ( appendix p 5 ). Fourth, little is known regarding the seasonality of coronavirus transmission. If 2019-nCoV, similar to influenza, has strong seasonality in its transmission, our epidemic forecast might not be reliable.
Identifying and eliminating the zoonotic source remains an important task to prevent new animal-to-human seeding events. The renewal of a complete ban on market trading and sale of wild game meat in China on Jan 26 can provide only temporary suspension of demand, even if completely adhered to. Vaccine platforms should be accelerated for real-time deployment in the event of a second wave of infections. Above all, for health protection within China and internationally, especially those locations with the closest travel links with major Chinese ports, preparedness plans should be readied for deployment at short notice, including securing supply chains of pharmaceuticals, personal protective equipment, hospital supplies, and the necessary human resources to deal with the consequences of a global outbreak of this magnitude.
Contributors
JTW, GML, and KL designed the experiments. KL collected data. JTW and KL analysed data. KL, JTW, and GML interpreted the results and wrote the manuscript.
Declaration of interests
We declare no competing interests.
Data sharing
Data obtained for this study will not be made available to others.
For the Tencent database see https://heat.qq.com/
For the Official Aviation Guide see https://www.oag.com/
Acknowledgments
We thank Chi-Kin Lam and Miky Wong from School of Public Health, The University of Hong Kong (Hong Kong, China) for technical support. This research was supported by a commissioned grant from the Health and Medical Research Fund from the Government of the Hong Kong Special Administrative Region .
Editorial note: the Lancet Group takes a neutral position with respect to territorial claims in published maps and institutional affiliations.
Supplementary Material
- Supplementary appendix
References
- 1. Superspreading and the effect of individual variation on disease emergence.Nature. 2005; 438: 355-359
- 2. Model parameters and outbreak control for SARS.Emerg Infect Dis. 2004; 10: 1258-1263
- 3. Transmission dynamics of the etiological agent of SARS in Hong Kong: impact of public health interventions.Science. 2003; 300: 1961-1966
- 4. Transmission dynamics and control of severe acute respiratory syndrome.Science. 2003; 300: 1966-1970
- 5. Transmission characteristics of MERS and SARS in the healthcare setting: a comparative study.BMC Med. 2015; 13: 210
- 6. The role of superspreading in Middle East respiratory syndrome coronavirus (MERS-CoV) transmission.Euro Surveill. 2015; 20: 14-18
- 7. Unraveling the drivers of MERS-CoV transmission.Proc Natl Acad Sci USA. 2016; 113: 9081-9086
- 8. MERS transmission and risk factors: a systematic review.BMC Public Health. 2018; 18: 574
- 9. Clinical impact of human coronaviruses 229E and OC43 infection in diverse adult populations.J Infect Dis. 2013; 208: 1634-1642
- 10. Epidemiology characteristics of human coronaviruses in patients with respiratory infection symptoms and phylogenetic analysis of HCoV-OC43 during 2010-2015 in Guangzhou.PLoS One. 2018; 13: e0191789
- 11. Epidemiology and clinical presentations of the four human coronaviruses 229E, HKU1, NL63, and OC43 detected over 3 years using a novel multiplex real-time PCR method.J Clin Microbiol. 2010; 48: 2940-2947
- 12. The epidemiology of severe acute respiratory syndrome in the 2003 Hong Kong epidemic: an analysis of all 1755 patients.Ann Intern Med. 2004; 141: 662-673
- 13. A comparative epidemiologic analysis of SARS in Hong Kong, Beijing and Taiwan.BMC Infect Dis. 2010; 10: 50
- 14. Comparison of incubation period distribution of human infections with MERS-CoV in South Korea and Saudi Arabia.Sci Rep. 2016; 6: 35839
- 15. Complete genomic sequence of human coronavirus OC43: molecular clock analysis suggests a relatively recent zoonotic coronavirus transmission event.J Virol. 2005; 79: 1595-1604
- 16. Incubation periods of acute respiratory viral infections: a systematic review.Lancet Infect Dis. 2009; 9: 291-300
- 17. Murray and Nadel's textbook of respiratory medicine.5th edn. Elsevier, Amsterdam2010
- 18. Preliminary epidemiological assessment of MERS-CoV outbreak in South Korea, May to June 2015.Euro Surveill. 2015; 20: 7-13
- 19. Seroprevalence of IgG antibodies to SARS-coronavirus in asymptomatic or subclinical population groups.Epidemiol Infect. 2006; 134: 211-221
- 20. Comparative serological study for the prevalence of anti-MERS coronavirus antibodies in high-and low-risk groups in Qatar.J Immunol Res. 2019; (published online Feb 18. DOI:10.1155/2019/1386740.)
- 21. Middle East respiratory syndrome coronavirus (MERS-CoV) neutralising antibodies in a high-risk human population, Morocco, November 2017 to January 2018.Euro Surveill. 2019; 24: 1900244
- 22. Development and application of an enzyme immunoassay for coronavirus OC43 antibody in acute respiratory illness.J Clin Microbiol. 1994; 32: 2372-2376
- 23. Examination of seroprevalence of coronavirus HKU1 infection with S protein-based ELISA and neutralization assay against viral spike pseudotyped virus.J Clin Virol. 2009; 45: 54-60
- 24. Middle East respiratory syndrome: what we learned from the 2015 outbreak in the Republic of Korea.Korean J Intern Med. 2018; 33: 233-246
- 25. An outbreak of human coronavirus OC43 infection and serological cross-reactivity with SARS coronavirus.Can J Infect Dis Med Microbiol. 2006; 17: 330-336
- 26. Human coronavirus alone or in co-infection with rhinovirus C is a risk factor for severe respiratory disease and admission to the pediatric intensive care unit: a one-year study in Southeast Brazil.PLoS One. 2019; 14: e0217744
- 27. Case fatality of SARS in mainland China and associated risk factors.Trop Med Int Health. 2009; 14: 21-27
- 28. Interhuman transmissibility of Middle East respiratory syndrome coronavirus: estimation of pandemic risk.Lancet. 2013; 382: 694-699
- 29. Middle East respiratory syndrome coronavirus: quantification of the extent of the epidemic, surveillance biases, and transmissibility.Lancet Infect Dis. 2014; 14: 50-56
- 30. The SARS epidemic in Hong Kong: what lessons have we learned?.J R Soc Med. 2003; 96: 374-378
- 31. SARS in healthcare facilities, Toronto and Taiwan.Emerg Infect Dis. 2004; 10: 777-781
- 32. Wuhan is expected to send 15 million passengers during Spring Festival in 2020 (in Chinese).http://hb.people.com.cn/n2/2019/1228/c194063-33671662.htmlDate: Dec 28, 2019Date accessed: January 2, 2020
- 33. An outbreak of NCIP (2019-nCoV) infection in China—Wuhan, Hubei Province, 2019–2020.China CDC Weekly. 2020; 2: 79-80
- 34. Early transmission dynamics in Wuhan, China, of novel coronavirus-infected pneumonia.N Engl J Med. 2020; (published online Jan 29. DOI:10.1056/NEJMoa2001316.)
- 35. Characterizing the dynamics underlying global spread of epidemics.Nat Commun. 2018; 9: 218
- 36. The effect of public health measures on the 1918 influenza pandemic in U.S. cities.Proc Natl Acad Sci USA. 2007; 104: 7588-7593
- 37. Frequently asked questions about SARS.
- 38. Mathematical epidemiology of infectious diseases: model building, analysis and interpretation.John Wiley, Chichester2000
- 39. Real-time epidemic forecasting: challenges and opportunities.Health Secur. 2019; 17: 268-275
- 40. Outbreak analytics: a developing data science for informing the response to emerging pathogens.Philos Trans R Soc Lond B Biol Sci. 2019; 374: 20180276
- 41. Improving the evidence base for decision making during a pandemic: the example of 2009 influenza A/H1N1.Biosecur Bioterror. 2011; 9: 89-115
- 42. MRC Centre for Global Infectious Disease Analysis: Wuhan coronavirus reports 1–3.https://www.imperial.ac.uk/mrc-global-infectious-disease-analysis/news–wuhan-coronavirusDate: January, 2020Date accessed: January 25, 2020
- 43. Novel coronavirus 2019-nCoV: early estimation of epidemiological parameters and epidemic predictions.medRxiv. 2020; (published online Jan 24. DOI:10.1101/2020.01.23.20018549 (preprint).)
- 44. Transmission dynamics of 2019 novel coronavirus (2019-nCoV).bioRxiv. 2020; (published online Jan 26. DOI:10.1101/2020.01.25.919787 (preprint).)
- 45. Preliminary estimation of the basic reproduction number of novel coronavirus (2019-nCoV) in China, from 2019 to 2020: a data-driven analysis in the early phase of the outbreak.bioRxiv. 2020; (published online Jan 24. DOI:10.1101/2020.01.23.916395 (preprint).)


30260-9&id=gr1.jpg)
30260-9&id=gr2.jpg)
30260-9&id=gr3.jpg)
30260-9&id=gr4.jpg)